
Dashboard
- What the Dashboard Shows
- The Four Cards
- Trend Arrows
- The 30-Day Chart
- Recent Sales
- If You Cannot See the Dashboard
- Where to Go for More Detail
- A Daily Habit
What the Dashboard Shows
Home > Dashboard is the first page many managers open each day. It gives a quick picture of how the business is doing. It is read-only. You need the dashboard.view permission.
The figures combine product sales and service sales. Only completed sales count. Voided sales are left out.
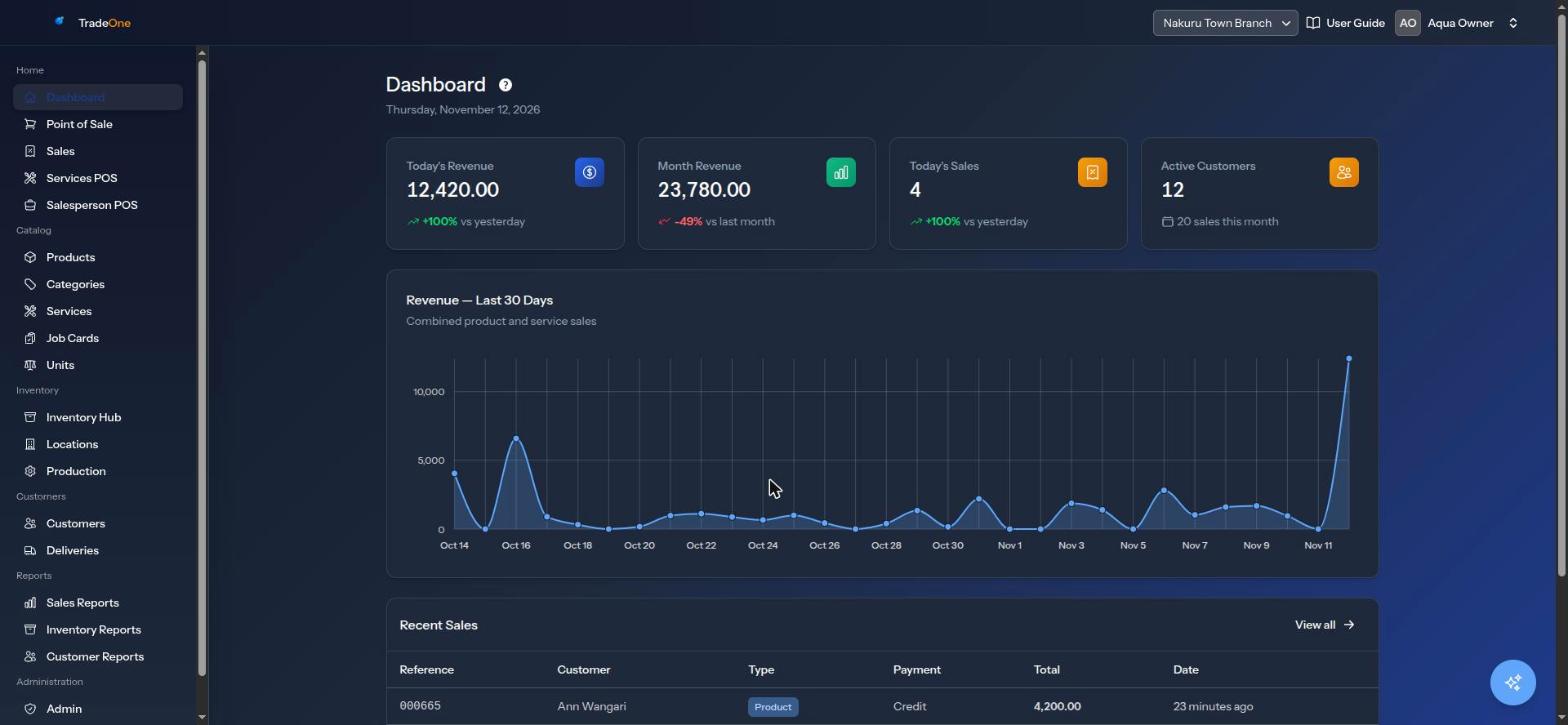
The Four Cards
| Card | What it shows |
|---|---|
| Today's Revenue | The total of today's completed sales, in KSh |
| Month Revenue | The total from the start of this month until now. It shows how many sales were made ("sales this month") |
| Today's Sales | How many sales were completed today |
| Active Customers | How many active customers you have |
"Revenue" here means the final total of each sale: after any discount, and including tax.
Trend Arrows
Three cards compare against an earlier period:
- Today's Revenue and Today's Sales compare with yesterday ("vs yesterday").
- Month Revenue compares with last month ("vs last month").
A green up arrow means you are ahead of that period. A red down arrow means you are behind. It compares like with like. Early in the day, today will look low against a full yesterday. It is not a target.
The 30-Day Chart
"Revenue — Last 30 Days" is a chart of daily revenue for the past 30 days. It says "Combined product and service sales". Use it to see the shape of the month: busy weekends, quiet weeks, the effect of a promotion.
Recent Sales
The table "Recent Sales" lists the latest completed sales with Reference, Customer, Type, Payment, Total and Date. A badge shows whether each is a Product or a Service sale. Press View all to open Sales History. If there are none you see "No sales yet."
If You Cannot See the Dashboard
If your role does not include dashboard.view, signing in sends you to the first page you may open: Point of Sale, Sales, Deliveries, Customers, Products, Inventory, Production or Sales Reports, in that order. If you may open none of them, you land on your account page.
Where to Go for More Detail
| I want to know | Go to |
|---|---|
| Which products made money | Sales Reports |
| What is running low | Inventory Reports |
| Who owes me | Customer Reports |
| Who sold what | Sales Reports |
| Who did what | User Trail |
You can also ask the AI Assistant a question such as "How much did we sell last week?".
A Daily Habit
A useful five-minute routine for the owner:
- Open the Dashboard in the morning. Look at Today's Revenue against yesterday later in the day.
- Check the 30-day chart for any sudden drop.
- Open Low Stock in Inventory Reports and place orders. See Purchases and Suppliers.
- Open Outstanding Balances in Customer Reports once a week.
- Glance at the Voided tab in Sales Reports to catch unusual cancellations.
For example, if Baraka Water Point usually takes about KSh 40,000 on a Friday and the dashboard shows KSh 18,000 by evening, check the Recent Sales list and the User Trail. A till may have been offline, or a delivery driver may have missed a run.